
A short example of CartoCSS class-based line rendering.
CartoCSS is everywhere it seems. Well, it’s in Mapbox Studio and CartoDB, as well as whatever hand rolled option you choose. (However it is not geoserver CSS, though it looks somewhat similar). I used CartoCSS to render the below image. It’s a nordic ski map and has a number of line style features worth noting.
1) The trails are catagorised green – blue – black to indicate difficulty.
2) The trails are labelled.
3) Some trails have an outline to indicate it is floodlit.
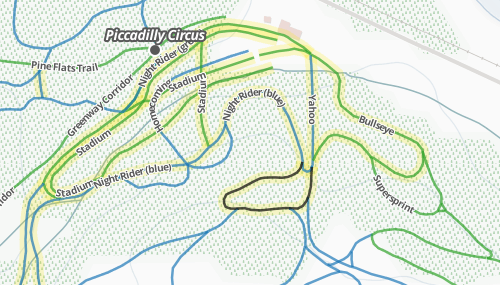
To achieve this effect we need to consider the line data. The data contains a “name”, a “difficulty” classification, and a “floodlit” boolean. From this we can define the below CartoCSS description. Note, the floodlit ::case must come first, so it is drawn first, if we leave this till the end it will obsure or decolorize, the thinner trail line, by being rendered on top. Additionally, the floodlit style is almost transparent, to give the effect of lighting with out changing the core informational content of the data layer.
#otway_ski_trails {
 line-width: 2.5;
 line-opacity: 0.7;

 [floodlit=true]{
 ::case {
 line-width: 12;
 line-color:#FFE403;
 line-opacity: 0.2;
 }
 }
 [difficulty="black"] {
 line-color: #000000;
 }
 [difficulty="blue"] {
 line-color: #1F78B4;
 }
 [difficulty="double black"] {
 line-color: #000000;
 line-dasharray: 10, 4;
 }
 [difficulty="green"] {
 line-color: #33A02C;
 }

 ::labels {
 text-name: [name];
 text-face-name: 'Open Sans Bold';
 text-size: 10;
 text-label-position-tolerance: 10;
 text-fill: #575757;
 text-halo-fill: #FFF;
 text-halo-radius: 1;
 text-dy: 0;
 text-allow-overlap: true;
 text-placement: line;
 text-placement-type: simple;
 }
}
The full effect of this style can be seen on our Otway Nordic Ski Center trail map. This map was built using Mapbox base maps, CartoDB line work, all brought together on a LeafletJS map.